Portfolio Management using Monte Carlo and Mean-Variance Optimization
— Portfolio Management, Monte Carlo, Mean Variance Optimization — 3 min read
Modern portfolio theory (MPT) is primarily attributed to Harry Markowitz, for which he received a Nobel prize in 1990. The main application of this theory is Portfolio management and, in particular, finding the efficient allocation of multiple stocks in order to achieve the highest return for the lowest volatility (or risk).
Theoretical context
To speak about the efficiency of the portfolios, we use the so-called Sharpe Ratio. This is simply the ratio of returns over risk (some
traders substract to the returns of the portfolio the return of a risk-free market but this is mostly irrelevant and at most offsets our result by a constant 1).
Mathematically, it is simply Sharpe = Returns / Risk where the risk is expressed as a standard deviation of the returns.
Monte Carlo is conceptually really easy; we essentially randomly choose weights for each stock in the portfolio and estimate the returns and volatility of each portfolio, and then choose the one with the highest Sharpe ratio.
In comparison, Mean-Variance Optimization relies on the covariance matrix to understand how assets move together in order to reduce unsystematic (random) volatility and simply maximize the Sharpe ratio
of portfolios with an initial guess, where the weights are the variables.
Results
We can observe an example of the final results we can get in the following picture. Here I chose the stocks "KO", "GOOGL","NVDA","PM","AVGO" and "PLTR" for a simple reason; I thought that the efficiency frontier looked good.
And indeed, you can judge for yourself:
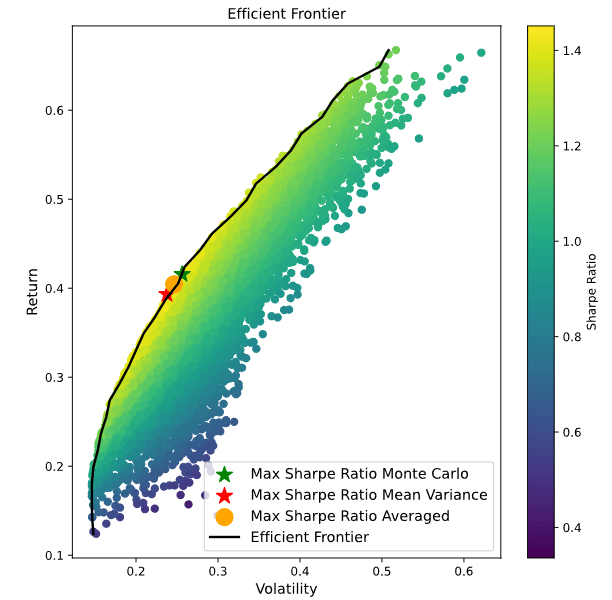 To get the final optimal portfolio, I averaged the two optimal portfolios obtained from Monte Carlo and from Mean Variance to get the following final weights :
 "KO" : 0.9%, "GOOGL" : 0.2%, "NVDA": 20.3%, "PM": 52%, "AVGO": 15.2%, "PLTR": 11.4%.
This optimal portfolio has an estimated return of 36.7% and a volatility of 22.2%, thus giving us a Sharpe Ratio of 1.65, which is rather satisfying (see literature).
Of course, this is a result that depends on the evaluation dates (which in my case were in between 2021-05-10 and 2025-05-10), and there's no way of guaranteeing such returns in the future.
Future improvements
This easy implementation gives a systematic, quick way to get a well diversified portfolio. The results of the analysis are of course dependent on the dates we choose for the historical analysis and those dates can be modified according to how long we intend on holding the portfolio or give an idea on how often it will have to get modified over time. The main problem is that this portfolio is rather unstable and not really robust (small changes in the return estimations of the stocks might change drastically the results, as is often the case with Monte Carlo simulations) because of its stochastic nature. I plan to explore more modern theories such as Arbitrage Pricing Theory, and possibly implement some machine learning model to improve on those results, and give them a bit more robustness.
Footnotes
-
See Ernest P. Chan, Quantitative Trading : How to build your own Algorithmic Trading Business for details ↩